Practitioner Reports
There are two practitioner reports that can be accessed from the Dashboard: the Totals Summary and Patient Return Rate.
Practitioners may view their own reports, but not the reports of other practitioners. Clinic Owners may view reports for all practitioners.
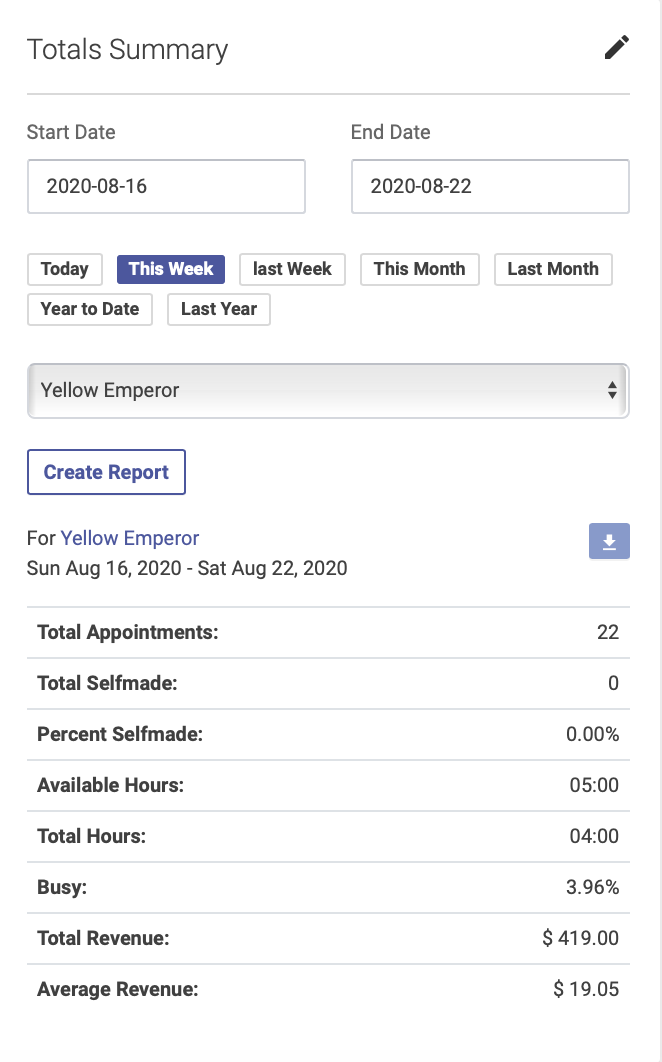
Totals Summary Report
This report shows a summary of a practitioner’s appointments for a given date range, including number of appointments, hours, busy rate and revenue. Click the pencil icon to select a preset or custom date range:
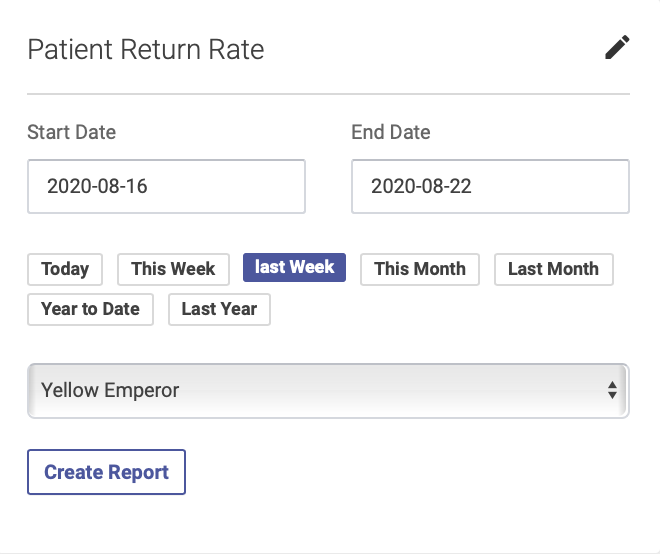
Patient Return Rate Report
This report shows the number new and returning patients for each practitioner. To run this report, click the pencil icon to select a preset or custom date range:
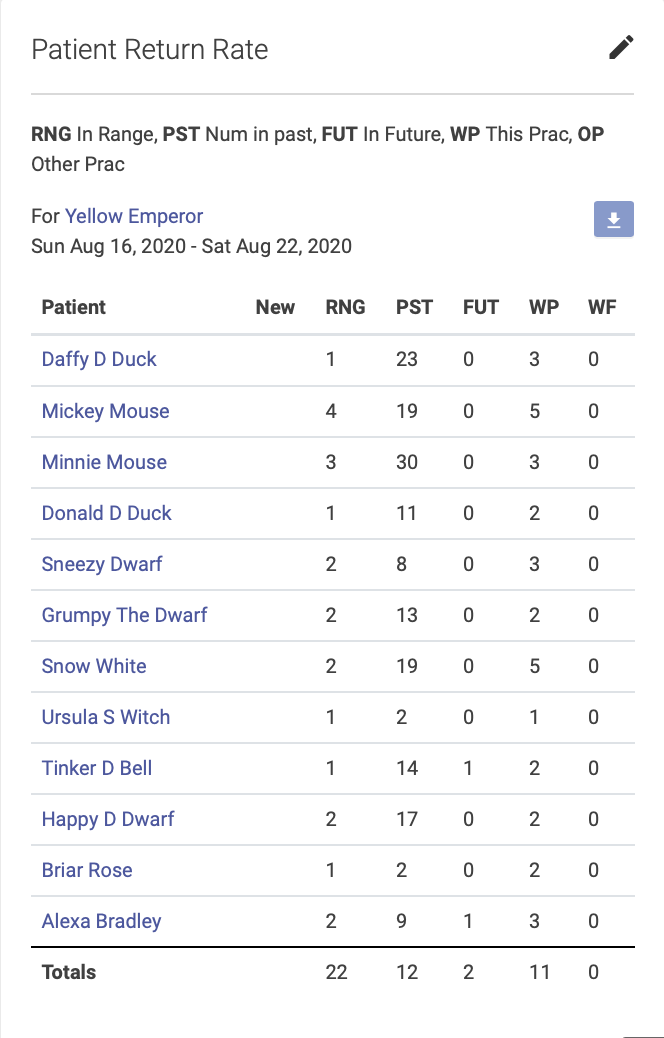
The columns will show numbers of new and returning patients, and the number of past and future appointments for each patient:
If you want to sort your data, you can use the arrow button at the top of the report to download your results to a spreadsheet.
To calculate your new patient return rate:
- Find your total number of new patients for the date range—this will appear at the bottom of the New column on the report.
- The next column, RNG, will show how many times a patient came in during that date range. The next column, PST, will show the total number of past appointments for that patient. f a patient has a 1 in the RNG column and a 1 in the PST column, that tells you they’ve only been in once. Add up your total number of patients who have only been in once.
- Subtract the number who have only been in once from the total number of new patients for the date range. This gives you your number of returns, which you can then use to calculate your return rate. For example, if you have 100 new patients in a date range, and 25 only came in once, that leaves you with 75 who came in more than once and therefore a 75% rate of return.